CSIRO Logo
Helping you optimise your sowing programs

Flowering Calculator

About

What is it?

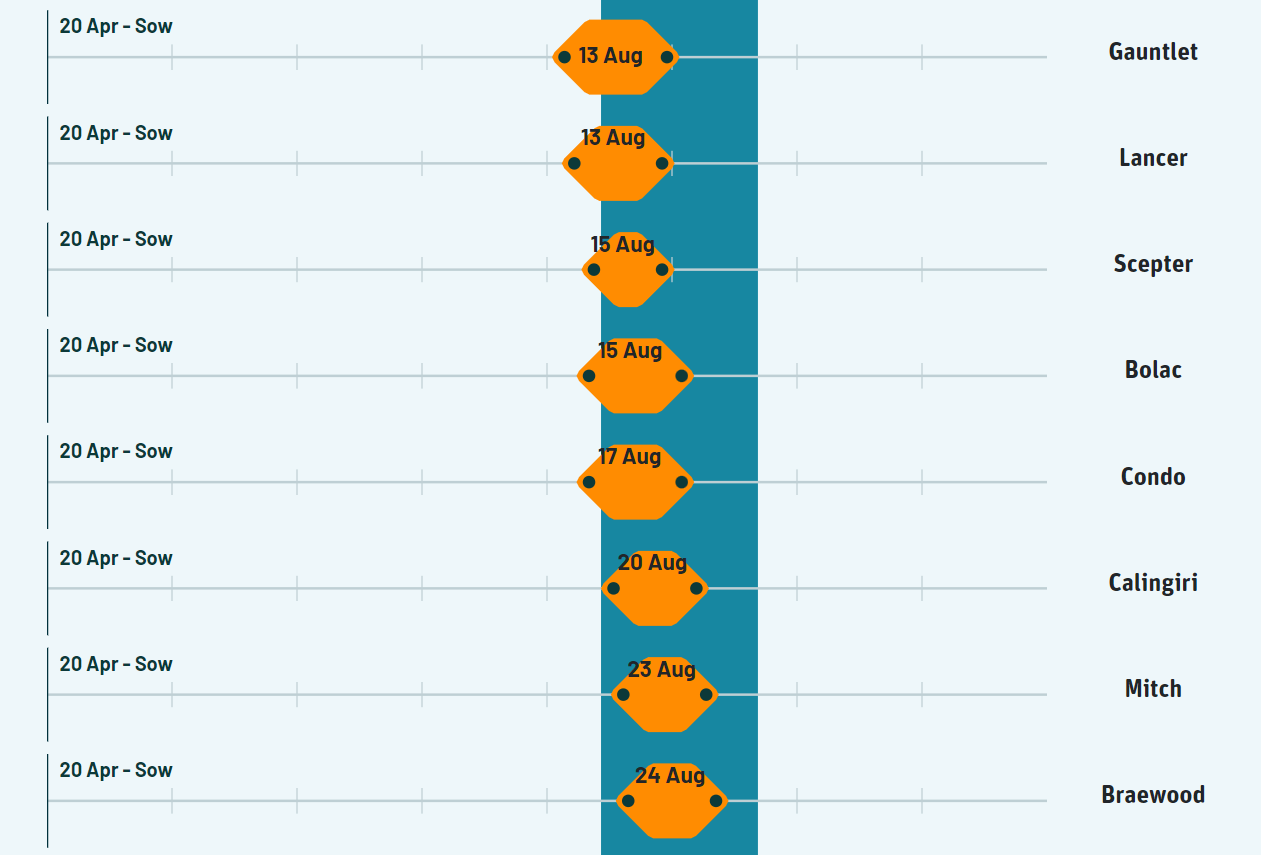
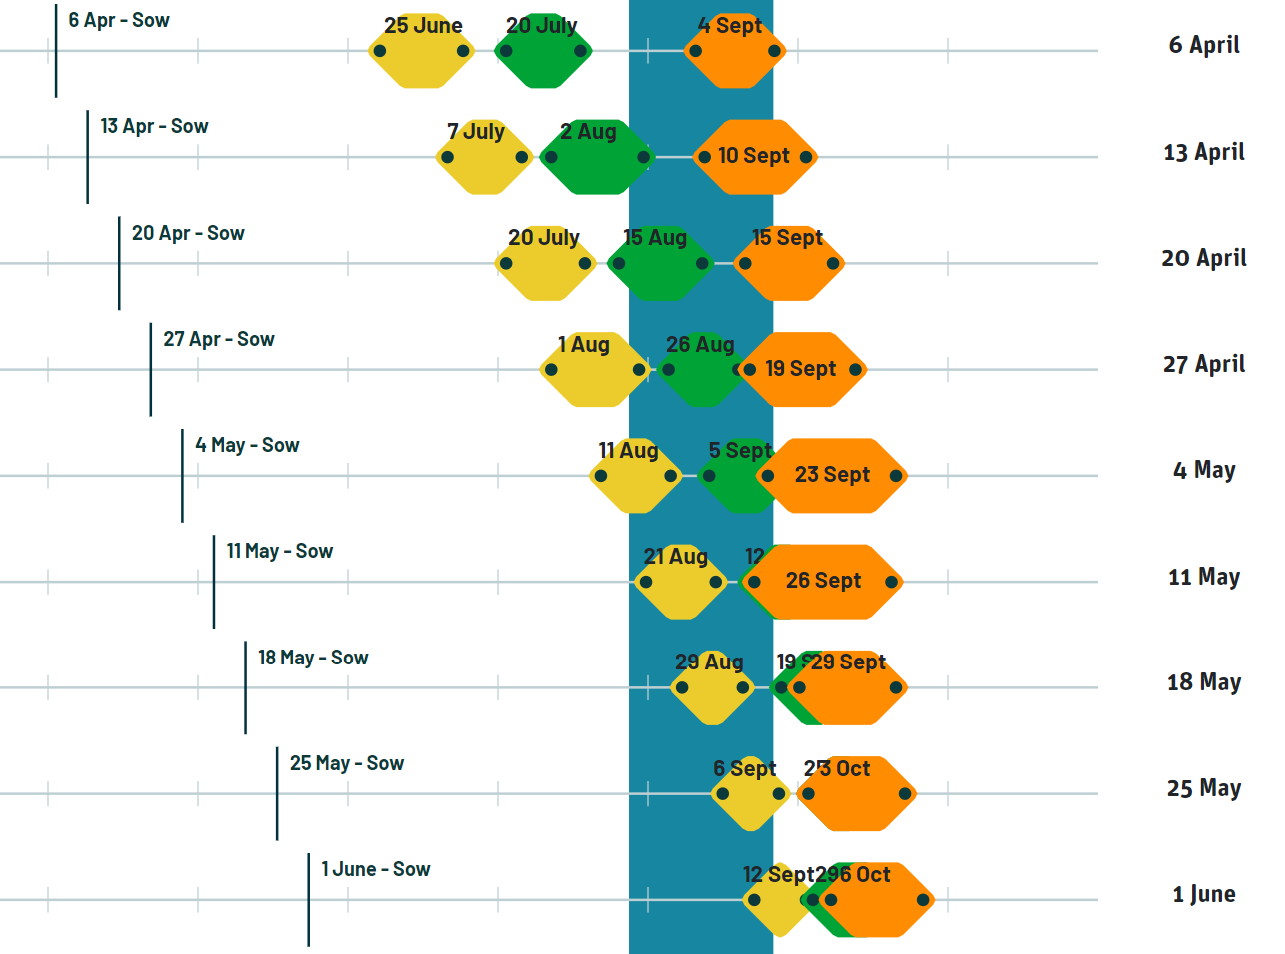
The Crop Flowering Calculator is a simple phenology model that uses 60 years of local weather data to calculate a range of possible flowering dates for a specific environment for wheat, barley and canola. The Crop Flowering Calculator integrates the scientific outputs from several GRDC projects and Initiatives (CSP00187, CSP1901-002RTX, UOM1806-001RTX). This tool brings together the diverse aspects of crop phenology (genetics, physiology and agronomy) together to create a tool that assists in matching sowing date to variety for each specific region. This tool has been funded by CSIRO in partnership with GRDC.

What is new?

The calculator will be kept updated using the genetic models which predict crop phenology in different environments and are validated against NVT data. New cultivars which have been entered in NVT will be added to the Crop Flowering Calculator at the time of commercial release, subject to approval by breeding companies.

How does it work?

Example A
The results page shows the outcomes of the model and is slightly different depending on if you are trying to find out which variety to sow, or when to sow. This example shows finding which variety is best for a particular sowing date. The orange box shows the range of start of flowering dates generated over the 60 years of simulations. The dark blue box is the optimal period for the start of flowering in this region. It is important to note that there may be several varieties that are within the optimal period. It is also important to remember that this is just a guide to the start of flowering. If you are a bit early you may lose some flowers to cold, if a bit late you may suffer some heat stress, but every season is different. If you know you are on a low paddock that frosts you may want to ensure you flower well into the optimal flowering period not at the beginning.
Example B
For this example, we are finding the optimal sowing date for a particular variety (you can select up to 3) in our location. Remember the hexagonal boxes are a distribution with the median in the middle and the range of flowering dates over the last 60 years at either end. You should select a sowing date that results in the variety you select falling in the optimal flowering period. This example shows the spread in flowering dates for 3 different phenology types for a range of sowing dates.
Fast cultivar
Mid cultivar
Slow cultivar
We are working to provide new cultivars to keep the Crop Flowering Calculator up to date.

Feedback

If you have any suggestions or comments on the Crop Flowering Calculator please contact us at feedback@cropflowering.com.au